Budget Facts and Figures Made Easy
With pages and pages filled with information and figures, the section of the state budget related to developmental services and regional centers is not all that approachable. But, the Association of Regional Center Agencies has made it alot easier by providing a funds flow chart for 2016-17 and some budget facts and figures presented in pie chart format.
And there are some interesting take aways:
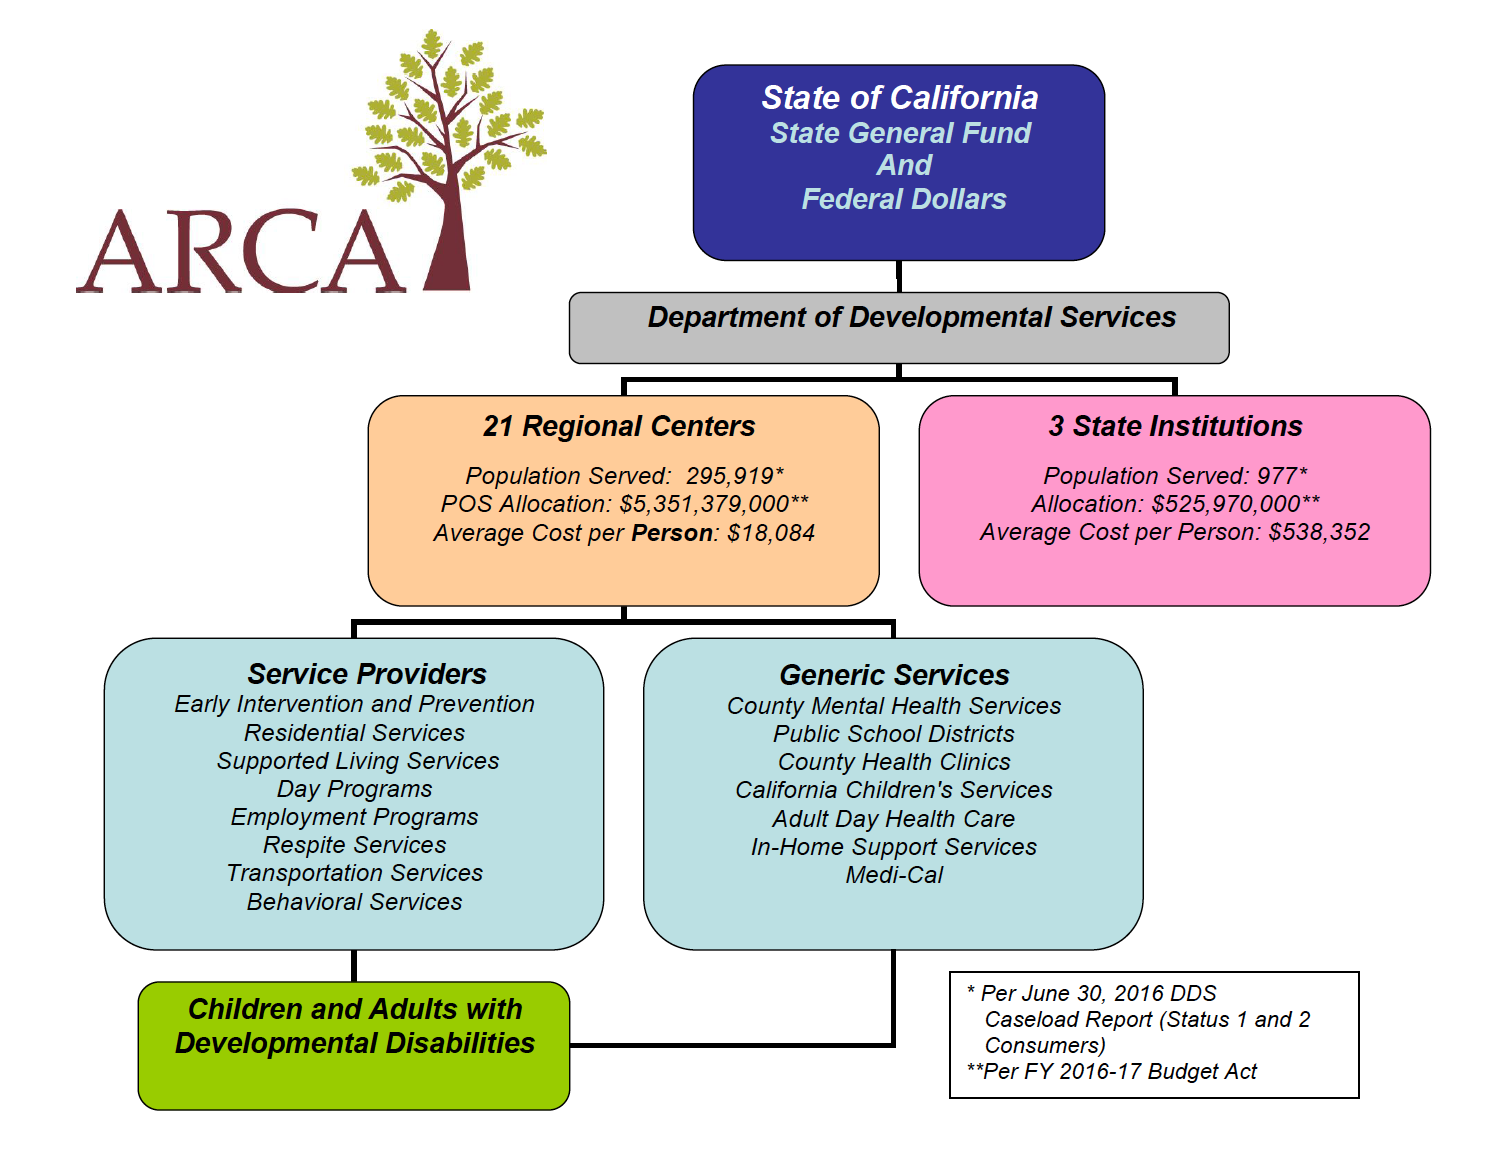
Funds Flow Chart 2016-17
This chart graphically depicts how the combination of state (“general fund”) and federal funds are moved through the State and to the services and supports required by persons with developmental disabilities. Points of note are the comparative cost-per-person of developmental centers versus community services, and the fact that generic services meet many needs, and must be accessed first.
Regional Center Budget and Demographic Information Charts
These charts show the breakdown of funds in our system, as well as some information on client characteristics. Major points, one per chart, are:
- Administrative expenses are less than a single percent.
- Federal funds (and meeting our promises that get those dollars) remain critical, providing 40 percent of our system’s $6 billion dollars.
- Regional center services are an order of magnitude more cost-effective than developmental center services.
- Residential services is the single largest cost component for people served.
- Early Intervention is a small but real portion of our population, and each person served has the potential for better, and less expensive, outcomes as a result.
- Again, residential services are the most expensive service provided – making it very important to help support people in the family home.
- Our community’s ethnicity is roughly reflective of the State, but cultural differences and socioeconomic issues drive the complex topic of barriers to service.
- While intellectual disabilities were, historically, the focus of our system, autism is the growing developmental disability.
- Nearly half of people served are under the age of 18. They are more likely to have autism, and are daily entering a community system built around different needs that needs to be rebuilt around new needs.
- Compare the costs of residential services as a portion of the budget against where people actually live. The family home is often – but not always – the preferred residence. Supporting families in their homes, such as respite services, meets their needs better, and is more cost-effective, too.
- Men continue to be disproportionately represented in our system, driven in part by the gendered prevalence of autism.
Take a minute to look through the charts for a better idea of how funds flow through and are broken down in our system.
Files